


By Professor Patrick Minford CBE
Productivity growth is at the centre of current policy debate because over most advanced economies, it has been sharply reduced since the Great Financial Crisis of 2008. The pandemic worsened matters, and since then there has been little productivity recovery.
In this article, I am focusing on the UK evidence on productivity growth, since it has shown particular variation since 1970 and it provides a unique laboratory to test theories of what causes it. There are many theories of growth and a large empirical literature accompanying them. To explain the UK evidence on growth the theory of most relevance1 is that productivity depends on firms’ incentives to improve products and processes via entrepreneurial action; these incentives in turn are affected by public policy – on property rights, marginal tax rates on business owners and regulation (particularly in the labour market). Both tax and regulation have varied substantially in the UK since 1970. Property rights under the law have been a constant, which we can therefore ignore.
A good and accessible review of the postwar evidence on how growth is damaged by tax is still the IEA’s Sharper Axes, Lower Taxes, published in 2011 and edited by Professor Philip Booth. Jon Moynihan in his recent book, Return to Growth, has also usefully surveyed the cross-country evidence that low tax countries grow faster.
One of the challenges for assessing the evidence on growth and its causes is establishing causation and not just association. Overcoming it requires building causal models of growth and testing their ability to replicate the facts of economies’ behaviour. With today’s powerful computers and recent advances in econometrics, we are able to do this by simulating these causal models and checking how well their simulations statistically match that behaviour – a roundabout procedure known as ‘indirect inference’.
In research carried out by my colleagues and me with our PhD students (some still unpublished) at Cardiff, we have found that this model of growth based on incentives can satisfyingly explain trends in growth and inequality in the UK both recently and over the last century and a half, as well as in the postwar US, and across Chinese regions.2

However, the research of most interest because of its unique experience is on the UK in the postwar period. There is a school of thought, well represented at the LSE and its Centre for Economic Performance, arguing that the key determinants of UK growth are planning permissions for housebuilding and infrastructure spending by the government. This ‘LSE view’ -see Zenghelis et al (2024)- has been adopted by the Labour Chancellor, Rachel Reeves, and has generally been stressed by the current Labour government, which in its first budget raised tax rates sharply but has since emphasised the need to reduce obstacles to infrastructure and housing investment – see speech by Rachel Reeves on growth, January 22, 2024.
Hence in this article we report on our testing not merely of our own incentives model but also of this view on the UK data.
Thus, we extend our model to include these other factors that have been argued to contribute to growth- including public spending on infrastructure and especially housing provision, both of which have been hindered in the UK by government policies that have given power to special interest groups opposing development on environmental grounds.
Our own growth model stresses the role of tax and regulation in creating disincentives for entrepreneurs. It also assumes that richer entrepreneurs are more responsive to incentives to innovate than poorer ones because they are less risk-averse – having more wealth to fall back on if things go wrong.
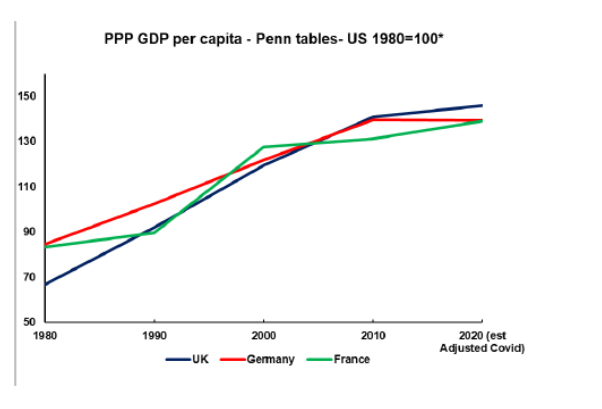
The UK effects of whatever was the magic ingredient in the 1980s are clearly visible in our lived experience since the Thatcher reforms of the 1980s, largely retained during the 1990s but since then progressively reversed by ill-considered, mostly EU-led, regulation combined with rising marginal tax rates. On GDP per capita, the UK had overtaken France and Germany in the 2000s as those reforms took effect, only to fall back relatively since then- see the following chart, based on the most widely used measure of GDP per capita at PPP calculated in the PENN world tables of national economies. This experience suggests that UK policy changes in this period, which were not happening elsewhere, were responsible, much as our growth theory implies. In the rest of this paper, we test that theory formally with econometric methods.
Testing models - how it works
How does our test work? Economists widely use tests of forecasting fit to the data over the sample- asking how well the model’s determining variables can ‘now-cast’ the data – e.g. GDP. The closer the fit of the now-cast the higher the likelihood of the model; if the probability exceeds some threshold such as 5%, the model is accepted. The problem with this test in small samples such as we have in macroeconomics is that false models can easily pass it because the false model’s past errors can predict future data almost as well as the true model. Hence the test has low ‘power’- that is, it rejects few false models.
Instead of using this data-likelihood test, known as ‘direct inference’, we use a test of how well the model, when simulated, can replicate the behaviour of key variables in the data. This ‘indirect inference’ test turns out to have high power, rejecting a high proportion of false models, this proportion rising sharply the more we falsify the model. The reason for this is that the behaviour we find in the data reflects the workings of the unknown true model. By simulating our candidate causal model many times with random shocks from the period we are creating parallel ‘potential histories’ of the period according to the model; we can then calculate the data behaviour these would imply, and create a probability distribution of its behavioural features. If the features in the actual data are quite like those in our candidate model, then this model will have a high probability of being the one generating the data, and so being the true model, which we know is the only one that is producing the actual data.
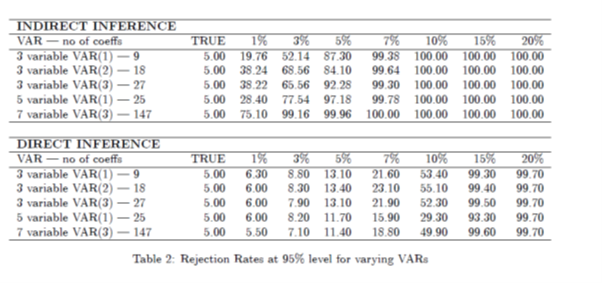
This method is powerful because a false model will generate behaviour different from the true model that is found in the actual data; the ‘match’ of the two will only be good if it is the true model that is being simulated. Only then will the features coincide. The closeness of the match is measured by the p-value: this measures the probability that this data behaviour came from this model. As any falseness in the model will change its behaviour, the matching test picks it up sensitively. We use a p-value of 5% as the threshold at which we reject the model as having too poor a match; this corresponds to the usual 95% confidence level for the test; an equivalent metric converts this into a t-statistic, whose 95% value is 1.645; values above this correspond to rejection. In our work we have checked out the properties of both the likelihood-based direct inference method and the indirect inference tests by Monte Carlo means, whereby we create an artificial laboratory in which we postulate a true model, create artificial data from it, and see how the two tests fare in their power to reject false models. We show the comparative results below in Table 1 for a structural (i.e. causal) macro model of the economy. What this Table shows is that when the data behaviour is described by different Vector Auto Regressions (VARs)3, with different numbers of variables and lags, and hence of VAR coefficients, then the rejection rate rises as the model parameters become more false, but it rises much more sharply under indirect inference than it does under direct inference. In fact, under indirect inference it rises progressively more sharply as the number of VAR coefficients rises, which implies we should limit this number, or we risk rejecting too many good models that get close to the data – e.g. being less than 5% false- typically we use 9, as in a 3 variable VAR (1) (i.e. with one lag). This is a problem that is good to have, as it allows us to choose strong power but not excessive power. This is not a problem with direct inference, as the power up to 5% falsity remains weak universally, with the rejection rate never rising much above 10%.
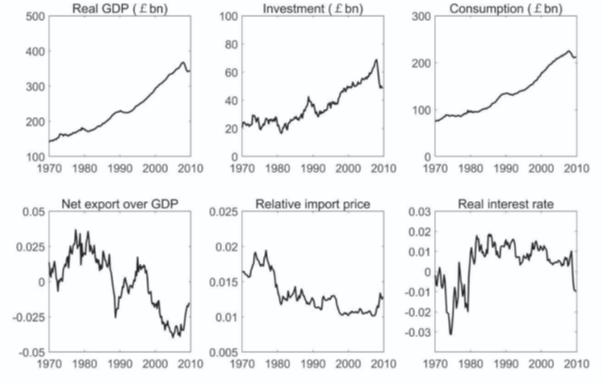
We can now discuss4 our data and how the various models of growth fare when tested by indirect inference using a VAR (1) of three variables, GDP, capital, and inequality, plus their residual variances (making a total of 12 coefficients).
UK data and test results
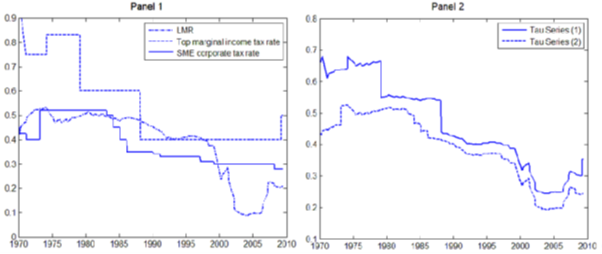
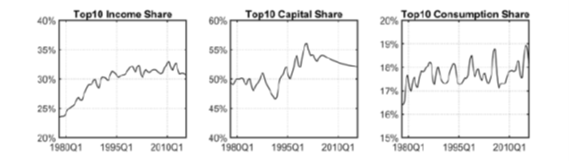
To estimate the data on the entrepreneurship disincentives from tax and regulation we use an index of labour market regulation (LMR), averaging indices of centralised collective bargaining (CCB) from the World Economic Forum and of the mandated cost of worker dismissal (MCD) from the World Bank, both reported by the Fraser Institute. For the other determinant, tax, the SME corporation tax rate (CTR) was used. The two, LME and CTR were averaged to create the overall disincentive variable (Tau 2) in the chart; it was interpolated to quarterly frequency using trade union membership. An alternative measure (Tau 1), which used the top marginal income tax rate instead of the corporation tax rate, gave similar results.
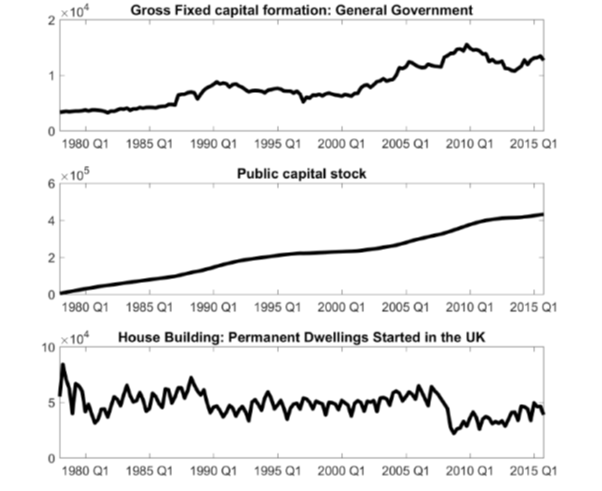
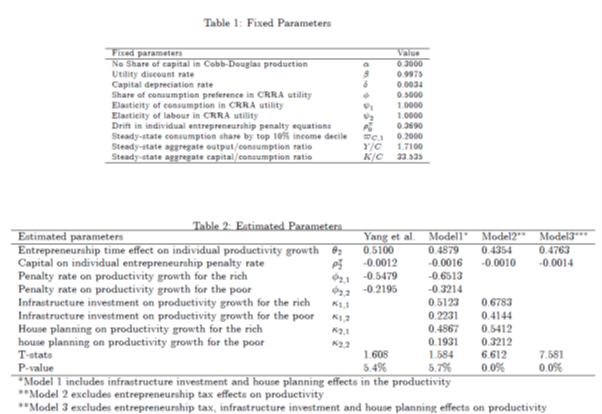
We begin by testing our basic model- as in the original version of Yang et al5 on UK data from 1978. Our aim is to see whether adding planning and infrastructure to the productivity equation- making model 1- improves the model’s match to the data behaviour. For the original model the p-value was 0.054, above the 95% confidence threshold. Next, we add the two variables suggested in the LSE work: planning permissions (proxied by house starts) and infrastructure (proxied by the publicly created capital stock). These when added- model 1- leave the p-value essentially unchanged at 0.057, indicating that they add no explanatory value. If we include them but exclude the tax and inequality terms (model 2) the model is strongly rejected with a p-value of zero. A general model (model 2) of exogenous productivity with no identified causal theory, is also strongly rejected with a p-value of zero. What this all means is that planning and infrastructure do not explain growth or even contribute to its explanation. What explains growth is the entrepreneurial tax and the extent of inequality in capital ownership.
Conclusions
We have set out a model of endogenous growth by entrepreneurial innovation in which the major influences are the tax/costs levied on firms' innovation and the extent of inequality (indicating the proportion of entrepreneurs who are rich). These last two factors stimulate innovation; this in turn creates growth which increases inequality as much of it accrues to rich entrepreneurs. We tested this model by indirect inference and found that it passed our test at 5% confidence.
Our aim in this paper was to add to this model an explanatory role for planning permission and infrastructure in the promotion of productivity growth, as argued by Zenghelis et al (2024). What we found was that these extra factors made no difference to the model's explanatory power. When put into the model as the sole explanatory factors (i.e.without the tax and inequality terms), the model was strongly rejected. Hence we find these factors make no explanatory contribution, either alone or in tandem with the tax and inequality factors.
This should not be taken to mean that housing and infrastructure do not matter. Plainly, they both affect welfare directly. Also while the evidence of the UK to date does not support them as factors affecting growth, this could be because during this period they did not change their behaviour enough. If these other factors were to be boosted sharply, as seems to be the current government’s intention, we should have future data to test whether and how far they are effective.
We conclude that the UK data support the original model based on entrepreneurs' incentives to innovate. The policy implication is that to stimulate growth these need to be enhanced.
Professor Patrick Minford CBE is Professor of Economics, Cardiff Business School, Cardiff University. He previously held economic positions in the Ministry of Finance, Malawi; Courtaulds Limited; H M Treasury; H M Treasury’s Delegation to Washington, DC; Manchester University; and The National Institute for Economic and Social Research. He was a member of Monopolies and Mergers Commission 1990-96 and one of the HM Treasury’s Panel of Forecasters (‘Six Wise Men’) 1993-1996. He is author of many books and articles on exchange rates, unemployment, housing and macroeconomics.
Footnotes
1 Growth also comes from economies of scale and learning by doing; however in a mature economy like the UK’s these are likely to play only a small role.
2 These are:
Work on UK: Minford, P., Gai, Y. & Meenagh, D. North and South: A Regional Model of the UK. Open Econ Rev 33, 565–616 (2022). https://doi.org/10.1007/s11079-021-09633-7
Minford, L., Meenagh, D. Supply-Side Policy and Economic Growth: A Case Study of the UK. Open Econ Rev 31, 159–193 (2020). https://doi.org/10.1007/s11079-019-09536-8
3 VARs take a group of variables in a ‘vector’ and regress them all on the lagged values of them all – e.g. a VAR(1) regress them on the once-lagged group, a VAR(2) on that and the twice-lagged and so on. The coefficients of this regression have values that come from the causal model when solved out. They are unique to a well-specified causal model.
4 A technical account of the models and the tests discussed here is set out in Minford,P. and Zhu, Z. ‘A heterogeneous-agent model of growth and inequality for the UK- do planning and infrastructure matter? A supplementary note’, Cardiff Business School working papers in economics no 13, 2025- https://carbsecon.com/wp/E2025_13.pdf The original model to which this is a supplementary note is Yang, X., Minford, P. & Meenagh, D. Inequality and Economic Growth in the UK. Open Econ Rev 32, 37–69 (2021). https://doi.org/10.1007/s11079-020-09598-z
5 Yang,X., Minford, P. and Meenagh, D. (2021) 'Inequality and Economic Growth in the UK', Open Economies Review, 2021, vol. 32, issue 1, No 2, 37-69.
This calculation of growth is somewhat convoluted. To see where growth occurs and how it gets that increase is interesting and on the face of it could determine how to get it again in the future but it’s like trying to count raindrops to test how heavy it’s raining! A great achievement to know, but does it matter in knowing it’s been raining? Let’s start with the first misconception as I see it… what is ‘growth’? Is it GDP? Because part of the figures that calculate GDP is government borrowing. So the more we borrow the greater the GDP! Now I’m not sure about you but, I don’t think evaluating wealth by how much money you owe as opposed to how much money you have got is not s good measure! Back to ‘GROWTH’. It means different things to different people. If we were producing currency based on population then the more people means the more money! So a growth in population could lead to a growth in money supply. ( I often ponder if we have enough money in our economy to begin with to make it all work) too little money can explain a stagnant economy. Or does growth mean greater production? But that doesn’t necessarily mean increased profit. The gist of extra wages or staff numbers or costs of equipment could all reduce profit. Could growth be profit itself? Is it just as simple as to increase prices? Or is it production? Can producing more get you the growth needed? Or is it just borrowing more? As that increases GDP? Well you see the dilemma? How do you quantify and qualify ‘growth’ no matter what positive or negative or score it can be such a stab in the dark you can easily ‘lose count of the raindrops’. I think ‘growth’ means one thing to Rachel Reeves… ‘increased tax take’. She calls it growth and assumes it comes from ‘growing the economy’. Which tells me she hasn’t got a scooby doo what she thinks she means! She can’t even tell us what she really means! It’s more tax revenue!! That’s the growth she means. She just guesses it comes from our economy growing but honestly, that’s cobblers. As you have shown, it’s difficult to see with numbers what’s got to be done. And your conclusions shine a little light onto the cause and possible cure. Bit if you had just thought it through you would have reached a better conclusion in my view…. We don’t need to get our head wet to know it’s raining!… we can look out the window to see the clues!!… so if I may I’d like to help you. We are in debt to the tune of nearly £3,000,000,000,000.00 trillion pounds! So in reality we haven’t had ‘growth’ for some time now. Not proper growth. Just pretend growth. So here is a great reason to reevaluate your calculations. We haven’t had any growth…Rodney! ( don’t you just love Del boys truthful innocence) you conclude the rich are important and your right! You conclude that low tax economy’s to better! But you have that round the wrong way. “Economy’s that work well have low tax”. Thats the correct way round. The basics I assert for a working economy are just two things! … ‘MONEY’ and ‘SPENDING’. No economy will work unless you have MONEY to SPEND. A government needs to have tax revenue to pay its way otherwise it won’t … pay its way!!!! So from this gentle snd simple beginnings we must framework the economy to supply money and allow a free and fair exchange of work between us to exchange our work for money and then exchange that money for goods and services to complete snd start that cycle again and again as if it were… raindrops! The free market and capitalism are the vehicles of present choice to achieve that. So as to generate the cycle of paid work to exchange for paid work and to siphon off a tax to the exchequer. It’s not a difficult process to follow but, it seems most people can’t see it! But it’s there!! As we know raindrops or transactions happen everywhere every day! We don’t need to know each one but for now we know it happens. That’s the free market! And that’s our economy. So let me turn to tax. The government are expected to tax for the income we need to pay our way. It should be blatantly obvious that we are not getting enough tax revenue and haven’t done for a very long time. So successive Chancellors have increased tax rates to try and plug the gap. Without first making sure the economy can afford it! There is the issue. Just like your calculations it’s fine on assumptions that haven’t been corrected. You see that increases in taxes strangle our economy. But still they do it as they can’t see any other way. So our stagnant economy becomes even worse with added pressure. No wonder we are in debt to nearly £3tn if that’s the best we can do! So the question now is how can that situation be improved? The main things we need is money and spending. Our economy has less money in the tax paying pot so we are not paying enough tax! Why? Because the rich have all the money!! That’s why. It’s not rocket science! It’s piggybank economics! If we produce less and pay less tax it’s because the pot is devoid of most of its money!… we have allowed the free market to tip out of balance. We have allowed our money to disappear abroad and we allow it to be held outside our economy where it contributes not only no tax but no exchange of work! They say 95% of all money is held by just 5% of people. I’m not sure if that’s true but let’s assume it’s a reasonably fair guess. Then 95% of us are trying to earn and exchange and pay taxes on just 5% of money! There is the problem!…. Right there. We can’t pay taxes or ourselves if the pit is too low in MONEY to SPEND! The two things we need to pay our way! So there is the problem and cause. I can give you my path to reverse that if you want? Can we debate it??