


Most people know that the number of drinkers and smokers is in decline in the UK, but you might be surprised to hear that the same is true of gamblers. For the first time since the early 1990s, gamblers are in the minority with only 48% of English adults engaging in any gambling activity in the past year.
This is largely because the National Lottery has become less popular. Only 31% of adults in England bought a lottery ticket in 2024, down from 65% in 1999. But fewer people are participating in non-lottery gambling too. As the graph below shows1, participation in non-lottery gambling has been in decline for well over a decade. These games are now played by a smaller proportion of the population than in the early 1990s.
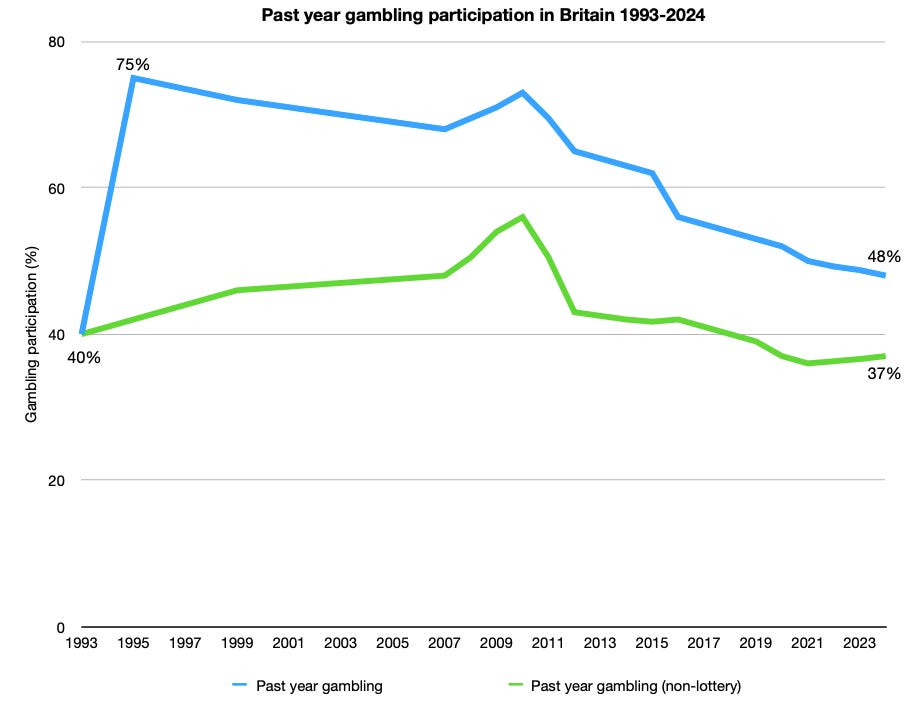
The launch of the National Lottery in 1994 turned millions of people into gamblers. A study published in 2000 found that between 1993/94 and 1995/96, gambling prevalence in Britain rose from 40% to 75%. The median household went from spending nothing on gambling to spending between £1.50 a week (in Northern Ireland) and £2.60 a week (in Northern England). But the novelty seems to have worn off. Half as many people play the lottery today, partly because the operator doubled the price of a ticket in 2013 and made it harder to win in 2015.
Leaving the lottery aside, the decline in gambling participation is striking, particularly given the many opportunities to gamble that now exist. Much of what is said about the “proliferation” of betting shops and adult gaming centres is nonsense - there are far fewer of them than there were in 2012 - but the internet has made gambling easier for nearly everybody and “Great Britain has one of the most accessible gambling markets in the world”. The Gambling Act of 2005 led to significant deregulation of parts of the sector and allowed many gambling companies to advertise for the first time.
And yet neither the Gambling Act nor the rise of internet gambling led to any sustained growth in the number of gamblers. On the contrary, prevalence has clearly fallen. This runs counter to ‘availability theory’ which says that increased accessibility and promotion of gambling will lead to more gamblers, more gambling and more gambling-related harm.
Before the Gambling Act came into effect in 2007, it was widely predicted that the rate of problem gambling would rise. “All commentators on Britain’s new gambling legislation, with the exception of industry representatives, think that the rate of gambling problems will rise as a result’, wrote the gambling researcher Jim Orford in Addiction in 2005. “Based on current international research,” wrote fellow academic Max Abbott, “it is likely that the UK prevalence of problem gambling will increase in the short to medium term, possibly 3- to 4- fold”. But this didn’t happen. There was a small and temporary increase in the number of gamblers between 2007 and 2010, but there was no increase in the problem gambling rate. As the graph below shows, the number of problem gamblers has held steady at between 0.3% and 0.7% of the adult population since 1999 when the first official estimates were made.1
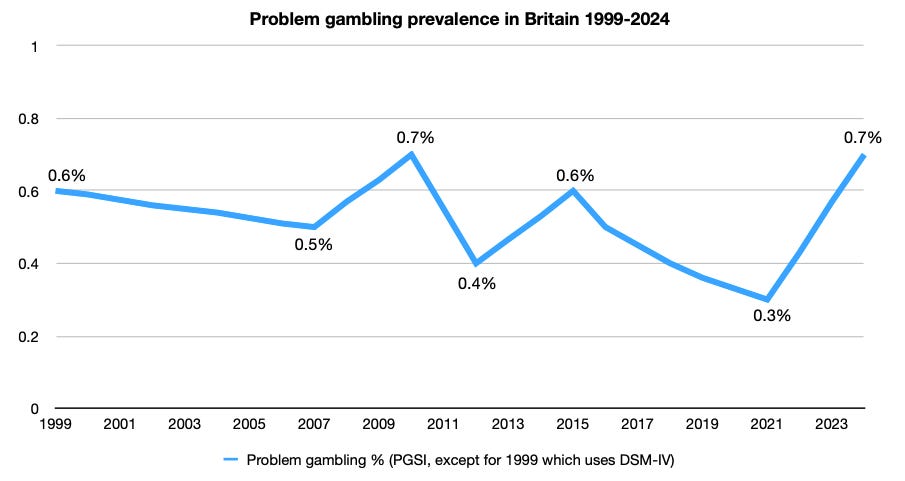
These numbers are small and have relatively large confidence intervals. The estimate of 0.7% in 2010, for example, had a confidence interval ranging from 0.5% to 1.0%. We therefore shouldn’t take year-to-year fluctuations too literally. It is implausible that the problem gambling rate halved between 2015 and 2021 and then more than doubled between 2021 and 2024. It is more likely that the true figure at every point in the series lies within the confidence intervals of each estimate at around 0.5% or 0.6%. The point is that there is no evidence of a downward trend.
This leads to two important conclusions. Ever since reliable data was first published in 1999, there has been no relationship between the availability of gambling and the number of gamblers in Britain, nor has there been a relationship between the number of gamblers and the number of people with gambling problems. Although the introduction of the National Lottery led to a sharp increase in gambling participation, this has faded over time. There is no way of knowing whether the introduction of the lottery (and scratchcards) led to an increase in the rate of problem gambling because we do not have good statistics prior to 1999, but if such a rise took place, the rate must have started from an extremely low base. Since then, it seems clear that the decline in the number of lottery players, and the decline in the number of people gambling in general, has not led to a reduction in the number of problem gamblers.
This is a challenge to the ‘whole population approach’ of gambling regulation that is fashionable in public health circles. Some academics have borrowed the ‘Total Consumption Model’ from the field of alcohol research to argue that a decline in per capita gambling consumption must inevitably lead to a reduction in consumption by the heaviest consumers and therefore a reduction in gambling-related harm. Proponents of this theory have said that “if the proportion of problem gamblers can be reduced by restricting the overall amount of gambling in a society—as implied from the total consumption model—population strategies aiming at reducing the overall gambling by controlling the determinants of gambling, may be the most effective strategy.” The determinants of gambling are, in the view of these academics, factors such as availability and advertising.

Measuring gambling-related harm is more difficult than measuring alcohol-related harm because very few deaths can be attributed to problem gambling (gambling is mentioned in only one coroner’s report per year in the UK, on average) and we do not have data on lesser harms such as family breakdown, let alone on tenuous harms such as “feeling guilty about gambling” or “less spending on other recreational activities”. Some researchers have argued that gambling expenditure can be used as a proxy for harm, but since gambling expenditure is also a measure of consumption, this would make the relationship between consumption and harm entirely tautological.
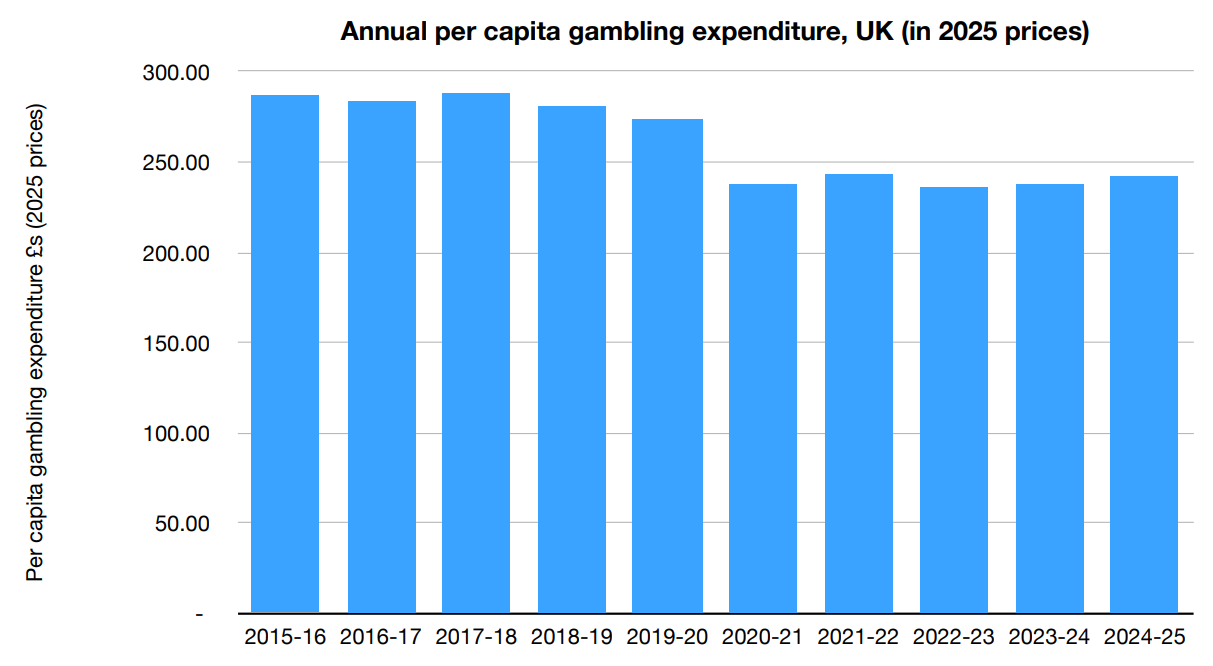
Gambling researchers have only occasionally looked for a link between gambling prevalence (the number of people who gamble) and problem gambling prevalence. Given their assumptions, they would expect a relationship to exist; people who do not gamble cannot be problem gamblers, after all. Instead, they have tended to look for a relationship between per capita gambling expenditure and problem gambling. This is somewhat tautological because problem gamblers account for a large proportion of gambling spend, but even if we accept that this is the appropriate test, the total consumption theory is not borne out by the UK data. As the graph below shows2, per capita gambling expenditure has declined by 16% in real terms since 2015/16 and yet, as we have seen, there has been no measurable decline in problem gambling.
There are some close parallels with alcohol. As with gambling, there was some controversial deregulation of drinking laws in the mid-2000s (the Licensing Act of 2003) which many experts predicted would lead to a surge in alcohol consumption and an inevitable rise in alcohol-related mortality. This did not happen. Instead, the introduction of the Act was followed by a substantial fall in alcohol consumption and a decline in the number of drinkers, but neither of these resulted in a reduction in alcohol-related mortality. A further decline in alcohol consumption during the pandemic was accompanied by a large rise in alcohol-related mortality. Both cases are remarkably similar. Availability increased but both consumption and participation fell, and there was no reduction in harm.
There is a simplicity to the whole population approach to gambling and alcohol that appeals to those who want large-scale state intervention. Taxes and bans might be unpopular with the majority of moderate drinkers and recreational gamblers, but people in ‘public health’ cite the Total Consumption Model as evidence that, as one of the originators of the theory, Geoffrey Rose, once put it: “to help the minority the ‘normal’ majority must change”. But it is still a mere theory and empirical evidence for it is sorely lacking.
Graph 1 and 2 are based on the British Gambling Prevalence Survey and the Health Survey for England.
Graph 3 is based on gambling industry revenue figures from the Gambling Commission and population estimates from the ONS.
 | A guest post by
|